EN
Strategic Evaluation of Total Cost of Ownership in Bottling Operations
Purchasing an automatic beverage filling machine is one of the largest capital expenditure investments a beverage production facility will undertake. Too often, procurement decisions rely heavily on the initial purchase price, leading to hidden financial drain over a five-to-ten-year machine lifecycle. True financial optimization demands a rigorous analysis of the total cost of ownership. Calculating this comprehensive metric allows plant operators and procurement directors to evaluate initial capital expenditure against long-term operational expenditure, utility consumption, waste generation, and unscheduled downtime.
The overarching total cost of ownership model for any industrial automatic beverage filling machine incorporates four primary financial vectors:
-
Initial Capital Expenditure (CapEx): Core machine acquisition, custom tooling, freight, customs, and civil installation.
-
Operational Expenditure (OpEx): Electrical power consumption, compressed air, CIP water usage, chemical reagents, and direct operator labor.
-
Maintenance and Spare Parts (MRO): Scheduled preventative maintenance, wear-part replacement schedules, emergency repairs, and technical support service contracts.
-
Loss and Risk Costs (Yield Losses): Liquid product giveaway due to dosing inaccuracy, bottle scrap rate during starwheel transfers, and revenue loss from unscheduled downtime.
Evaluating an automatic beverage filling machine through this multi-dimensional framework prevents short-sighted purchasing decisions and ensures long-term return on investment across high-speed packaging lines.
CapEx Baseline Assessment Beyond the Sticker Price
While initial acquisition price is the most visible number on any quotation, it represents only 20 to 30 percent of the total cost of ownership over a typical ten-year operational span. Evaluating CapEx accurately requires incorporating all ancillary expenditures necessary to bring the automatic beverage filling machine to commercial production readiness.
A realistic CapEx calculation includes:
-
Base Machine Procurement: Main rotary chassis, filling valve assemblies, mechanical capping turrets, and electronic control panels.
-
Container Changeover Tooling: Custom starwheels, guide plates, and capping chucks required for multi-format bottle handling.
-
Logistics and Duty: Transoceanic freight, port handling charges, localized transport, and import tariff duties.
-
Installation and Site Acceptance Testing (SAT): Factory technician daily rates, travel expenses, utility drop integration, and performance validation trials.
Ignoring these ancillary line items leads to budget overruns before the automatic beverage filling machine processes a single liter of liquid product.
Operational Expenditure and Energy Efficiency Metrics
Ongoing utility and resource consumption represent the largest cumulative share of long-term operational expenditure. High-speed bottling lines run continuously, meaning minor differences in motor efficiency, vacuum pump water usage, or compressed air demand compound into substantial financial variations over thousands of operating hours.
| Financial and Technical Evaluation Parameter | Standard Isobaric Filling Machine | Advanced Servo-Driven Electronic Filling Machine |
| Main Motor Energy Demand | 15.5 kW constant load AC induction motor | 9.2 kW direct-drive servo motor array |
| Compressed Air Volume | 1.8 cubic meters per minute at 6 bar | 0.9 cubic meters per minute at 6 bar |
| Water Consumption (Rinsing & CIP) | 4.5 cubic meters per operational hour | 2.1 cubic meters per operational hour via recovery loop |
| Liquid Filling Accuracy Tolerance | +/- 2.5 milliliters per 500 ml container | +/- 0.5 milliliters per 500 ml container (mass flow meter) |
| Changeover Time (Multi-format) | 120 minutes (manual mechanical adjustment) | 25 minutes (tool-less quick-change Starwheels) |
| Expected Annual Maintenance Cost | 8 percent to 12 percent of base machine CapEx | 3 percent to 5 percent of base machine CapEx |
As highlighted in the comparison, selecting an automatic beverage filling machine equipped with flow-meter dosing and direct-drive servo motors reduces electrical load and compressed air consumption significantly. Over a five-year window, the utility savings generated by an efficient automatic beverage filling machine often surpass the initial CapEx price differential of higher-tier equipment.
Quantifying Product Giveaway and Container Scrap Rates
Yield loss is an insidious element within the total cost of ownership calculation. Liquid product giveaway occurs when inaccurate mechanical filling valves overfill containers to guarantee minimum net weight compliance. For high-value liquids like natural juices, cold-brew coffee, or spirits, overfilling by even two milliliters per bottle generates staggering financial loss across millions of units.
Consider a production line outputting 12,000 bottles per hour operating 4,000 hours annually:
-
Line Volume: 48,000,000 bottles per year.
-
Overfill Volume: 2 milliliters excess liquid per bottle equals 96,000 liters of product giveaway annually.
-
Product Cost: At a bulk liquid production cost of 0.50 USD per liter, overfilling costs 48,000 USD every year in pure profit loss.
Similarly, structural container scrap caused by aggressive bottle handling or mechanical jamming inside transfer starwheels adds directly to the total cost of ownership. Modern automatic beverage filling machine designs utilize gentle neck-handling grippers, smooth deceleration curves, and electronic torque monitoring to keep bottle scrap rates below 0.05 percent of total production volume.
Maintenance Schedules and Preventive MRO Costs
Unscheduled downtime is the ultimate destroyer of operational profitability. When an automatic beverage filling machine suffers a mechanical failure during a production run, the cost extends beyond the immediate price of the broken gear or seal; it includes idle labor, lost batch throughput, and potential retail delivery penalties.
A thorough total cost of ownership model evaluates:
-
Wear-Part Lifespan: Average operating hours before dynamic O-rings, valve diaphragms, and capping chuck inserts require mandatory replacement.
-
Preventive Maintenance Kits: Availability, pricing, and recommended replacement intervals for standardized service packages.
-
Technical Support Availability: Remote diagnostic capabilities, local field service engineering presence, and guaranteed spare parts dispatch response times.
Choosing an automatic beverage filling machine manufactured with standardized, internationally available components (such as Siemens PLCs, Festo pneumatics, and SEW-Eurodrive motors) ensures long-term maintenance costs remain predictable and manageable.
Long-Term Value Creation and Equipment Selection
Calculating total cost of ownership transforms machine procurement from a simple cost-center transaction into a strategic investment decision. By looking beyond the initial quotation and analyzing five-year operational costs, beverage brands secure higher operational efficiency, lower utility overhead, and superior profit margins.
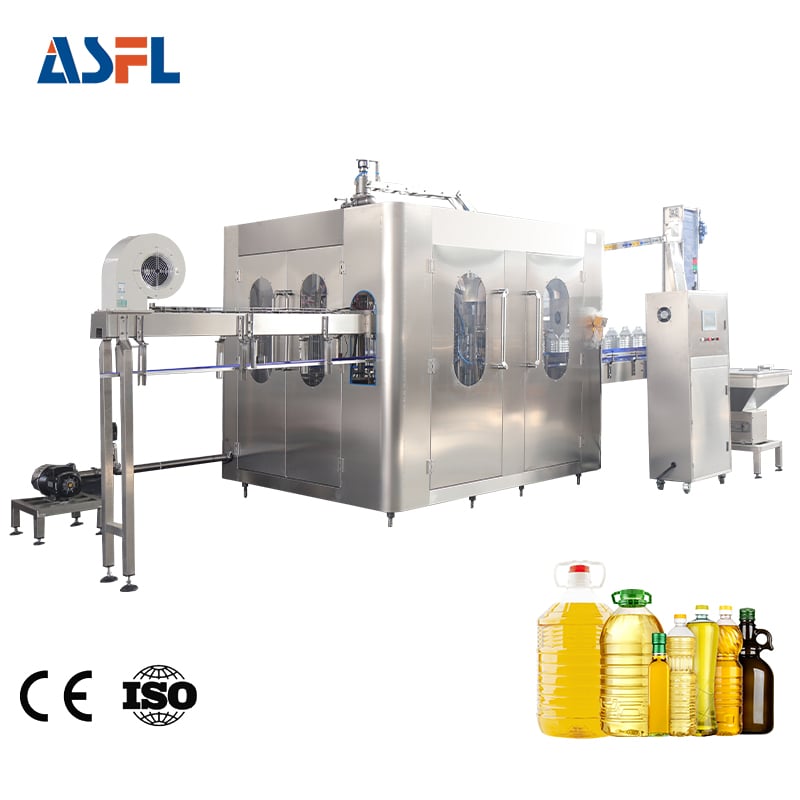
Industry-leading machinery suppliers, such as ACE-FILLING, engineer high-efficiency automatic beverage filling machine solutions designed specifically to minimize total cost of ownership. Incorporating precision flow-meter dosing, hygienic stainless steel construction, and low-energy drive systems, their equipment delivers reliable performance while keeping operational costs under strict control. Production managers and equipment specifiers can review detailed machinery parameters, utility consumption figures, and technical documentation by visiting
Summary of Total Cost of Ownership Framework
To execute a complete total cost of ownership comparison between competing automatic beverage filling machine options, procurement teams should follow this systematic review protocol:
-
Calculate True CapEx: Sum base machinery pricing, custom changeover tooling, ocean freight, import duties, and complete factory installation costs.
-
Compute Annual Utility OpEx: Measure real kilowatt-hour consumption, compressed air volume, water usage, and chemical sanitization costs based on target production hours.
-
Factor Product Giveaway: Multiply dosing inaccuracy tolerances by annual production volume and raw liquid product cost per liter.
-
Estimate Maintenance Overhead: Require vendor service histories to establish realistic annual wear-part costs and preventative maintenance expenses.
-
Assess Downtime Vulnerability: Evaluate component quality, local spare parts stock levels, and remote diagnostic capabilities to minimize unscheduled line stops.
Implementing this structured framework empowers beverage manufacturers to select an automatic beverage filling machine that optimizes production performance while delivering the lowest long-term operational cost.

 Hot News